InfectionControl.tips: The Power of Data to Improve Hand Hygiene and Reduce HAIs
Abstract
While hand hygiene is widely considered to be the most important factor in preventing healthcare-associated infections (HAIs), hand hygiene compliance rates in hospitals still average around 40 percent. Improving hand hygiene has been a challenge for well over 150 years. Fortunately, today’s technology provides rich data sets that can be leveraged to improve hand hygiene and reduce HAIs. There are seven types of data available today that can assist hospital managers in ensuring that both compliance and patient safety are high. Properly leveraging technology can significantly improve tracking of hand hygiene compliance. Data is a powerful tool that can be leveraged to improve hand hygiene, reduce HAIs and save lives.
Main Article
While hand hygiene is widely considered to be the most important factor in preventing healthcare-associated infections (HAIs)1,2, hand hygiene compliance rates in hospitals still average around 40 percent3. Sadly, improving hand hygiene has been a challenge for well over 150 years4. Fortunately, today’s technology provides rich data sets that can be leveraged to improve hand hygiene and reduce HAIs through improved compliance. There are seven types of data available today that can assist hospital managers to understand their hand hygiene compliance rates:
- Individual hand hygiene compliance
- Patient condition/transmission risk
- In-the-moment reminders
- Number of hand hygiene opportunities
- Missed opportunities
- Room location and resource availability
- Real-time text messages
This data is seamlessly gathered by electronic hand hygiene monitoring technology. There are a number of systems on the market. For example, the Clean Hands – Safe Hands system uses badge reels, which clip to a provider’s scrubs and hold their credentials. These badge reels identify each provider and communicate with the system via Bluetooth. Together, the system monitors hand hygiene compliance (and provides a reminder to sanitize when a clinician forgets).
Individual Hand Hygiene Compliance
The foundation for improving hand hygiene compliance is changing behaviour regarding current hand hygiene compliance. Today’s electronic hand hygiene monitoring systems can measure when a clinician cleans their hands. Electronic systems can provide more real-time data than manual methods such as using “secret shoppers” or direct observation. Direct observation is subject to a host of human biases5, including the Hawthorne Effect, where providers who know they are being watched are three times as likely to clean their hands6. Although any influence on encouraging or improving hand hygiene is a good thing, direct observation can only capture a fraction of hand hygiene opportunities as compared to automated methods that can collect data in every patient room7.
Figure 1 shows an example report of an individual’s hand hygiene compliance, comparing it over time and to others’ data. Each provider can see their own data, and managers can view the compliance of people that report to them.

Figure 1: Example of a report of an individual’s hand hygiene compliance.
Capturing hand hygiene data on an individual basis is an effective way to improve individual change in behaviour. In grouped data, the individuals remain anonymous which limits the ability to incentivize change in behaviour. However, when each provider is monitored individually, there is accountability and managers can identify the individuals who may need intervention8.
Patient Condition
While proper hand hygiene is important when caring for all patients, it is especially critical when working with quarantined patients. Healthcare workers need additional time to put on and remove personal protective equipment (PPE). In addition, they need to sanitize their hands before donning and after doffing gloves, which is confusing or forgotten by some providers9.
Patients with Clostridioides difficile bring different concerns. C. difficile spores are resistant to alcohol-based hand rubs10, so healthcare workers caring for C. difficilepatients are typically required to wash their hands with soap and water before leaving the room, rather than sanitizer. Here too, some clinicians are confused or forget that they need to use soap11.
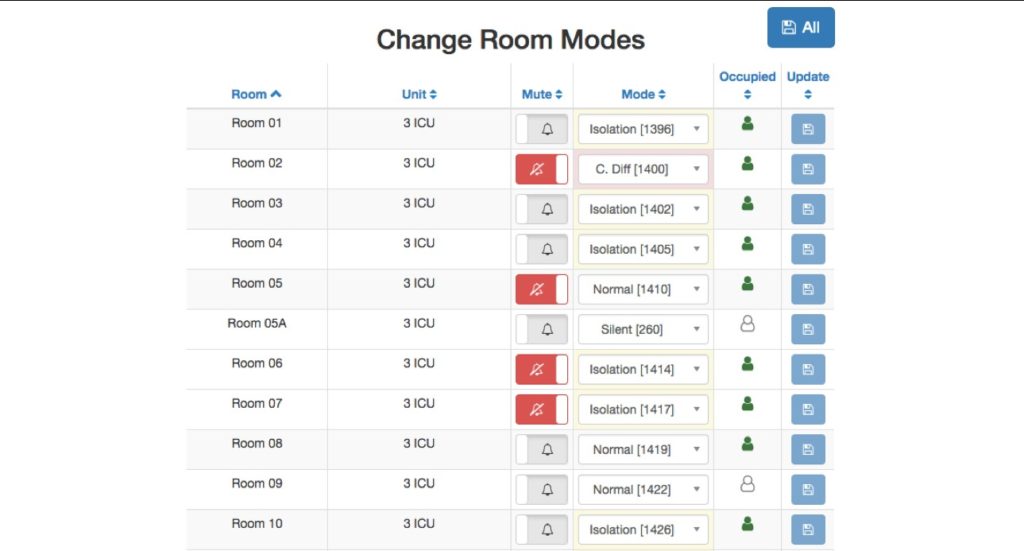
Some electronic hand hygiene monitoring systems can adapt to different patient hand hygiene protocols by patient condition. Figure 2 shows a type of system interface that allows staff to change room modes, including for C. difficile patients, where clinicians are reminded to use soap and water on exit rather than sanitizer. For isolation rooms, providers are given more time to put on PPE. This type of granular data makes it easier to ensure providers are performing hand hygiene appropriately.

Figure 2: Example of an electronic hand hygiene monitoring system
that adapts to different patient conditions.
In-The-Moment Reminders
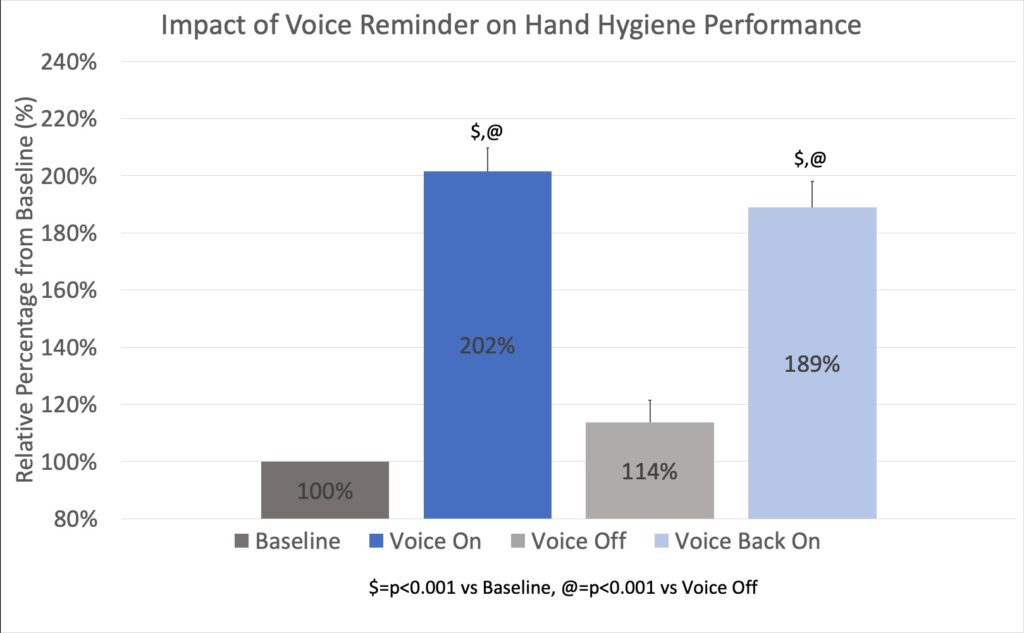
Monitoring is not the same as changing behaviour and improving results. As a hospital executive recently told us, “You don’t make a chicken fatter by weighing it.”. The electronic hand hygiene technologies that have published the highest compliance rates and lowest HAI rates use an in-the-moment reminder telling providers to clean their hands when they forget12. This may be a light, beep, vibration and/or a human voice to get the clinician’s attention and gently remind them to sanitize or wash. This is typically far more effective at immediately driving hand hygiene change than the traditional approach of having a staff meeting to discuss last month’s hand hygiene averages. Figure 3 shows a typical hospital’s compliance after the reminder (in this case, a human voice) is turned on. Of course, offering a reminder generates another set of data that can provide insights as to how and when the reminder was most effective and any scenarios where it is less effective.

Figure 3: Average hand hygiene compliance before and after an in-the-moment reminder was turned on. The reminder was later turned off and then back on again.
Number of Hand Hygiene Opportunities
To determine hand hygiene compliance, you must also measure hand hygiene opportunities, or the number of times providers are supposed to clean their hands. There are typically two underlying causes for healthcare workers with low hand hygiene compliance. First, for some clinicians, low compliance is due to an education issue. As previously noted, they may not realize they need to clean their hands after removing gloves, or that they have to wash their hands with soap and water when leaving a C. difficile patient’s room. There is a lot of confusion around hand hygiene protocols at most hospitals, even among senior level providers13.
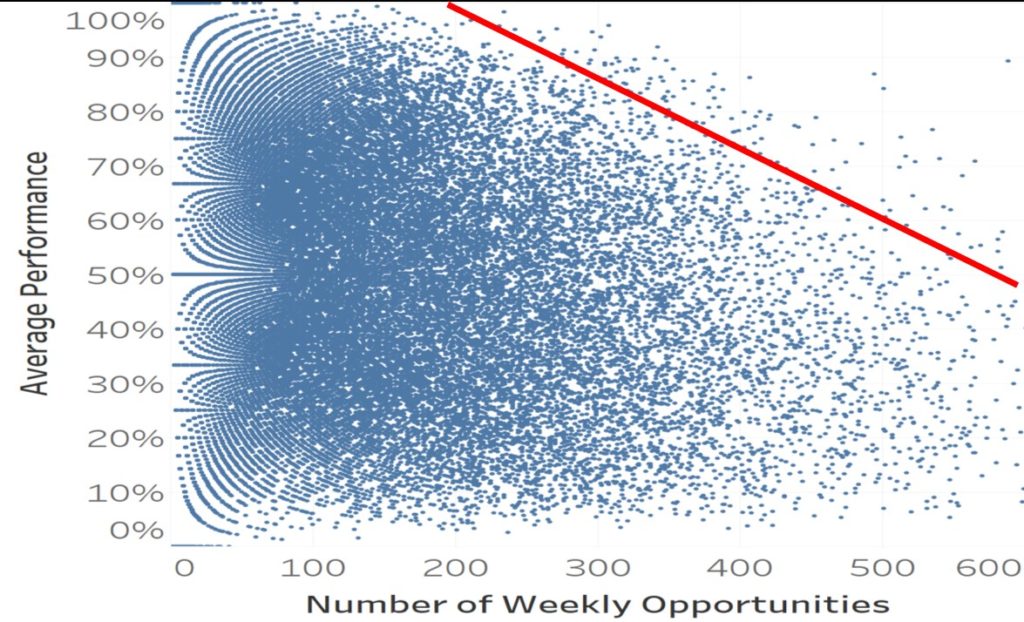
Second, the other cause for poor compliance is a workflow issue. The number of hand hygiene opportunities is often inversely correlated with hand hygiene compliance14. That is, healthcare workers with more hand hygiene opportunities – the busier clinicians – usually have lower hand hygiene compliance rates. This is demonstrated in Figure 4.

Figure 4: This workflow-adjusted compliance chart shows that as providers get busier (more hand hygiene opportunities), their hand hygiene compliance falls. The red line shows the 90th percentile of compliance.
For healthcare workers with few hand hygiene opportunities and poor compliance, the most effective intervention is education15. Teaching (or re-teaching) a hospital’s hand hygiene protocols is the most effective strategy here. For busier clinicians, re-education would be a waste of time. It is more effective to observe their workflows and find bottlenecks that can be removed. The goal is to make them more efficient and reduce unnecessary patient room entries and exits. Of course, this can only be done if you have individual level data including both the number of hand hygiene opportunities and compliance. Otherwise, it is impossible to identify whether to approach a struggling individual with education or workflow help.
Missed Opportunities
If an individual’s total number of hand hygiene opportunities and their hand hygiene compliance percentage are known, simple math will give you their missed opportunity percentage, or how often they were supposed to clean their hands but failed to do so. This data helps identify the clinicians who may need additional education or help with their workflow. However, it is important to look at absolute numbers as well as percentages. Since percentages do not include the number of hand hygiene opportunities, they can be misleading. For example, John has a hand hygiene compliance rate of 80 percent, meaning he has a missed two out of 10 hand hygiene opportunities. Jane has a hand hygiene compliance rate of 50 percent, meaning she has performed half of her hand hygiene opportunities. On the surface, it looks like Jane could benefit from intervention but looking at the overall number of opportunities for each person tells a different story. John had a total of 1000 hand hygiene opportunities last month, meaning he cleaned his hand 800 times and missed the opportunity to do so 200 times. On the other hand, Jane had 100 hand hygiene opportunities last month, meaning she cleaned her hands 50 times and missed the opportunity to do so 50 times. While the goal is for each caregiver to miss zero hand hygiene opportunities, every hospital has limited resources and data can be used to prioritize. You might need to have a conversation with John (who missed 200 opportunities) first and then Jane (who missed 50 opportunities). Figure 5 shows an example of how much variation there is by provider, both in terms of number of hand hygiene opportunities and compliance.


Figure 5: This missed opportunity bubble plot shows how many hand hygiene opportunities each clinician has (size of circle) and their hand hygiene compliance (color of circle).
Room Location and Resource Availability
Understanding individual behaviour is important for compliance, but other factors, such as location can also impact compliance rates. Some of this variation is due to patient conditions (such as patient quarantine or isolation) and some is due to the layout of the unit and each room. Figure 6 shows how much hand hygiene compliance can vary by hospital room. Hand hygiene compliance may be high in rooms far away from the supply closet (healthcare workers need to plan ahead and bring in all their supplies at once), but low in rooms next to the supply closet (where clinicians end up going in and out of the patient room multiple times to procure more supplies). It could even be as simple as a room where the sanitizer dispenser is mounted in an inconvenient place. Looking at hand hygiene data by room can shed light on these one-off situations so they can be ameliorated.

Figure 6: This unit blueprint shows hand hygiene compliance – darker green is higher and darker red is lower. The shape shows whether it is a normal room (circle), C.difficile (X) or isolation (+). The size of the shape indicates the number of hand hygiene opportunities – larger shapes indicate more opportunities.
Real-Time Text Messages
There are electronic hand hygiene monitoring systems on the market today that can use hospital room hand hygiene compliance data to alert management in real-time when there is a problem. A text message is automatically sent to the unit manager, pinpointing the problem and asking them to investigate. This allows the provider to rectify the situation promptly, potentially averting an infection from spreading. Conversely, if all is well, they can recognize their team’s high performance, as seen in Figure 7. Data also monitors the response to these interventions to measure their effectiveness.

Figure 7: Example of a real-time text message that can be sent to a unit manager a few hours into a shift, alerting them to a high-risk situation before it becomes a problem or, as shown, providing information on high compliance so they can recognize staff with positive reinforcement.
Conclusion
Today’s electronic hand hygiene solutions provide a wealth of actionable data and insights that can be leveraged to identify the highest risk providers, patients and rooms. This data, combined with in-the-moment reminders for clinicians and real-time interventions for managers, can actually change the behaviour of clinicians and improve patient safety.
References
- Allegranzi B, Pittet D. Role of hand hygiene in healthcare-associated infection prevention. J Hosp Infect 2009; 73:305-15.
- Pittet D. Compliance with hand disinfection and its impact on hospital-acquired infections. J Hosp Infect 2001;48(Suppl A):S40-46.
- Erasmus, V, Daha TJ, Brug H, Richardus JH, Behrendt MD, Vos MC, et al. Systematic review of studies on compliance with hand hygiene guidelines in hospital care. Infect Control Hosp Epidemiol 2010;31:283-94.
- Best M, Neuhauser D. Ignaz Semmelweis and the birth of infection control. BMJ Quality & Safety 2004;13:233-234.
- Sax H, Allegranzi B, Chraiti MN, Boyce J, Larson E, Pittet D. The World Health Organization hand hygiene observation method. Am J Infect Control 2009; 37:827-34.
- Srigley, JA, et al., Quantification of the Hawthorne effect in hand hygiene compliance monitoring using an electronic monitoring system: a retrospective cohort study. BMJ Qual Saf, 2014. 23(12): p. 974-80.
- Srigley JA, Furness CD, Baker GR, Gardam M. Quantification of the Hawthorne effect in hand hygiene compliance monitoring using an electronic monitoring system: a retrospective cohort study. BMJ Qual Saf 2014;23:965-7.
- Steinberg, JP (2018, April). Improving Hand Hygiene Adherence Using an Electronic System: What Works? Paper presented at The Society for Healthcare Epidemiology of America (SHEA), Portland, OR.
- Ellison III, RT. Gloves are no substitute for proper hand hygiene. Journal Watch. https://www.medscape.com/viewarticle/756746.
- Cohen SH, Gerding DN, Johnson S, Kelly CP, Loo VG, McDonald LC et al. Clinical practice guidelines for Clostridium difficileinfection in adults: 2010 update by the society for healthcare epidemiology of America (SHEA) and the infectious diseases society of America (IDSA). Infect Control Hosp Epidemiol 2010; 31(5):431-455.
- Hermann, C. (2018, July 19). The New C. diff Guidelines’ Impact on Hand Hygiene. Retrieved December 12, 2018, from https://cleanhands-safehands.com/c-diff-hand-hygiene/
- Hermann, C. (2018). [Correlation of hand hygiene opportunities with hand hygiene compliance]. Unpublished raw data.
- Hermann, C. (2018, July 19). The New C. diff Guidelines’ Impact on Hand Hygiene. Retrieved December 12, 2018, from https://cleanhands-safehands.com/c-diff-hand-hygiene/
- Hermann, C. (2018). [Correlation of hand hygiene opportunities with hand hygiene compliance]. Unpublished raw data.
- Hermann, C. (2019). How Hospitals Reduce Infections by Over 60%: The Power of the Voice to Finally Solve Hand Hygiene. Unpublished manuscript.
To read the original article on InfectionControl.tips, click here.